Car Accidents by Car Type
Then, we want to know how types of cars are associated with the number of accidents. A bar plot of the number of accidents by car type clearly represents the relationship.
Number of Accidents by Car Type
accidents2 = accidents1 %>%
  group_by(vehicle_type_code_1) %>%
  summarize(obs = n()) %>%
  arrange(desc(obs))

accidents_cartype_bar =
  accidents2 %>%
  filter(obs > 100) %>%
  filter(!is.na(vehicle_type_code_1)) %>%
  filter(obs > 500) %>%
  mutate(vehicle_type = fct_reorder(vehicle_type_code_1, obs)) %>%
  ggplot(aes(x = vehicle_type, y = obs, fill = vehicle_type)) +
  geom_bar(stat = "identity") +
  theme_classic() +
  labs(title = "Number of Accidents by Car Type",
       y = "Number of Accidents",
       x = "Car Type") +
  geom_text(size = 3, aes(label = obs), position = position_dodge(width=0.9), vjust=-0.25) +
  ylim(0, 45000)

accidents_cartype_bar + theme(axis.text.x=element_blank(), axis.ticks.x=element_blank())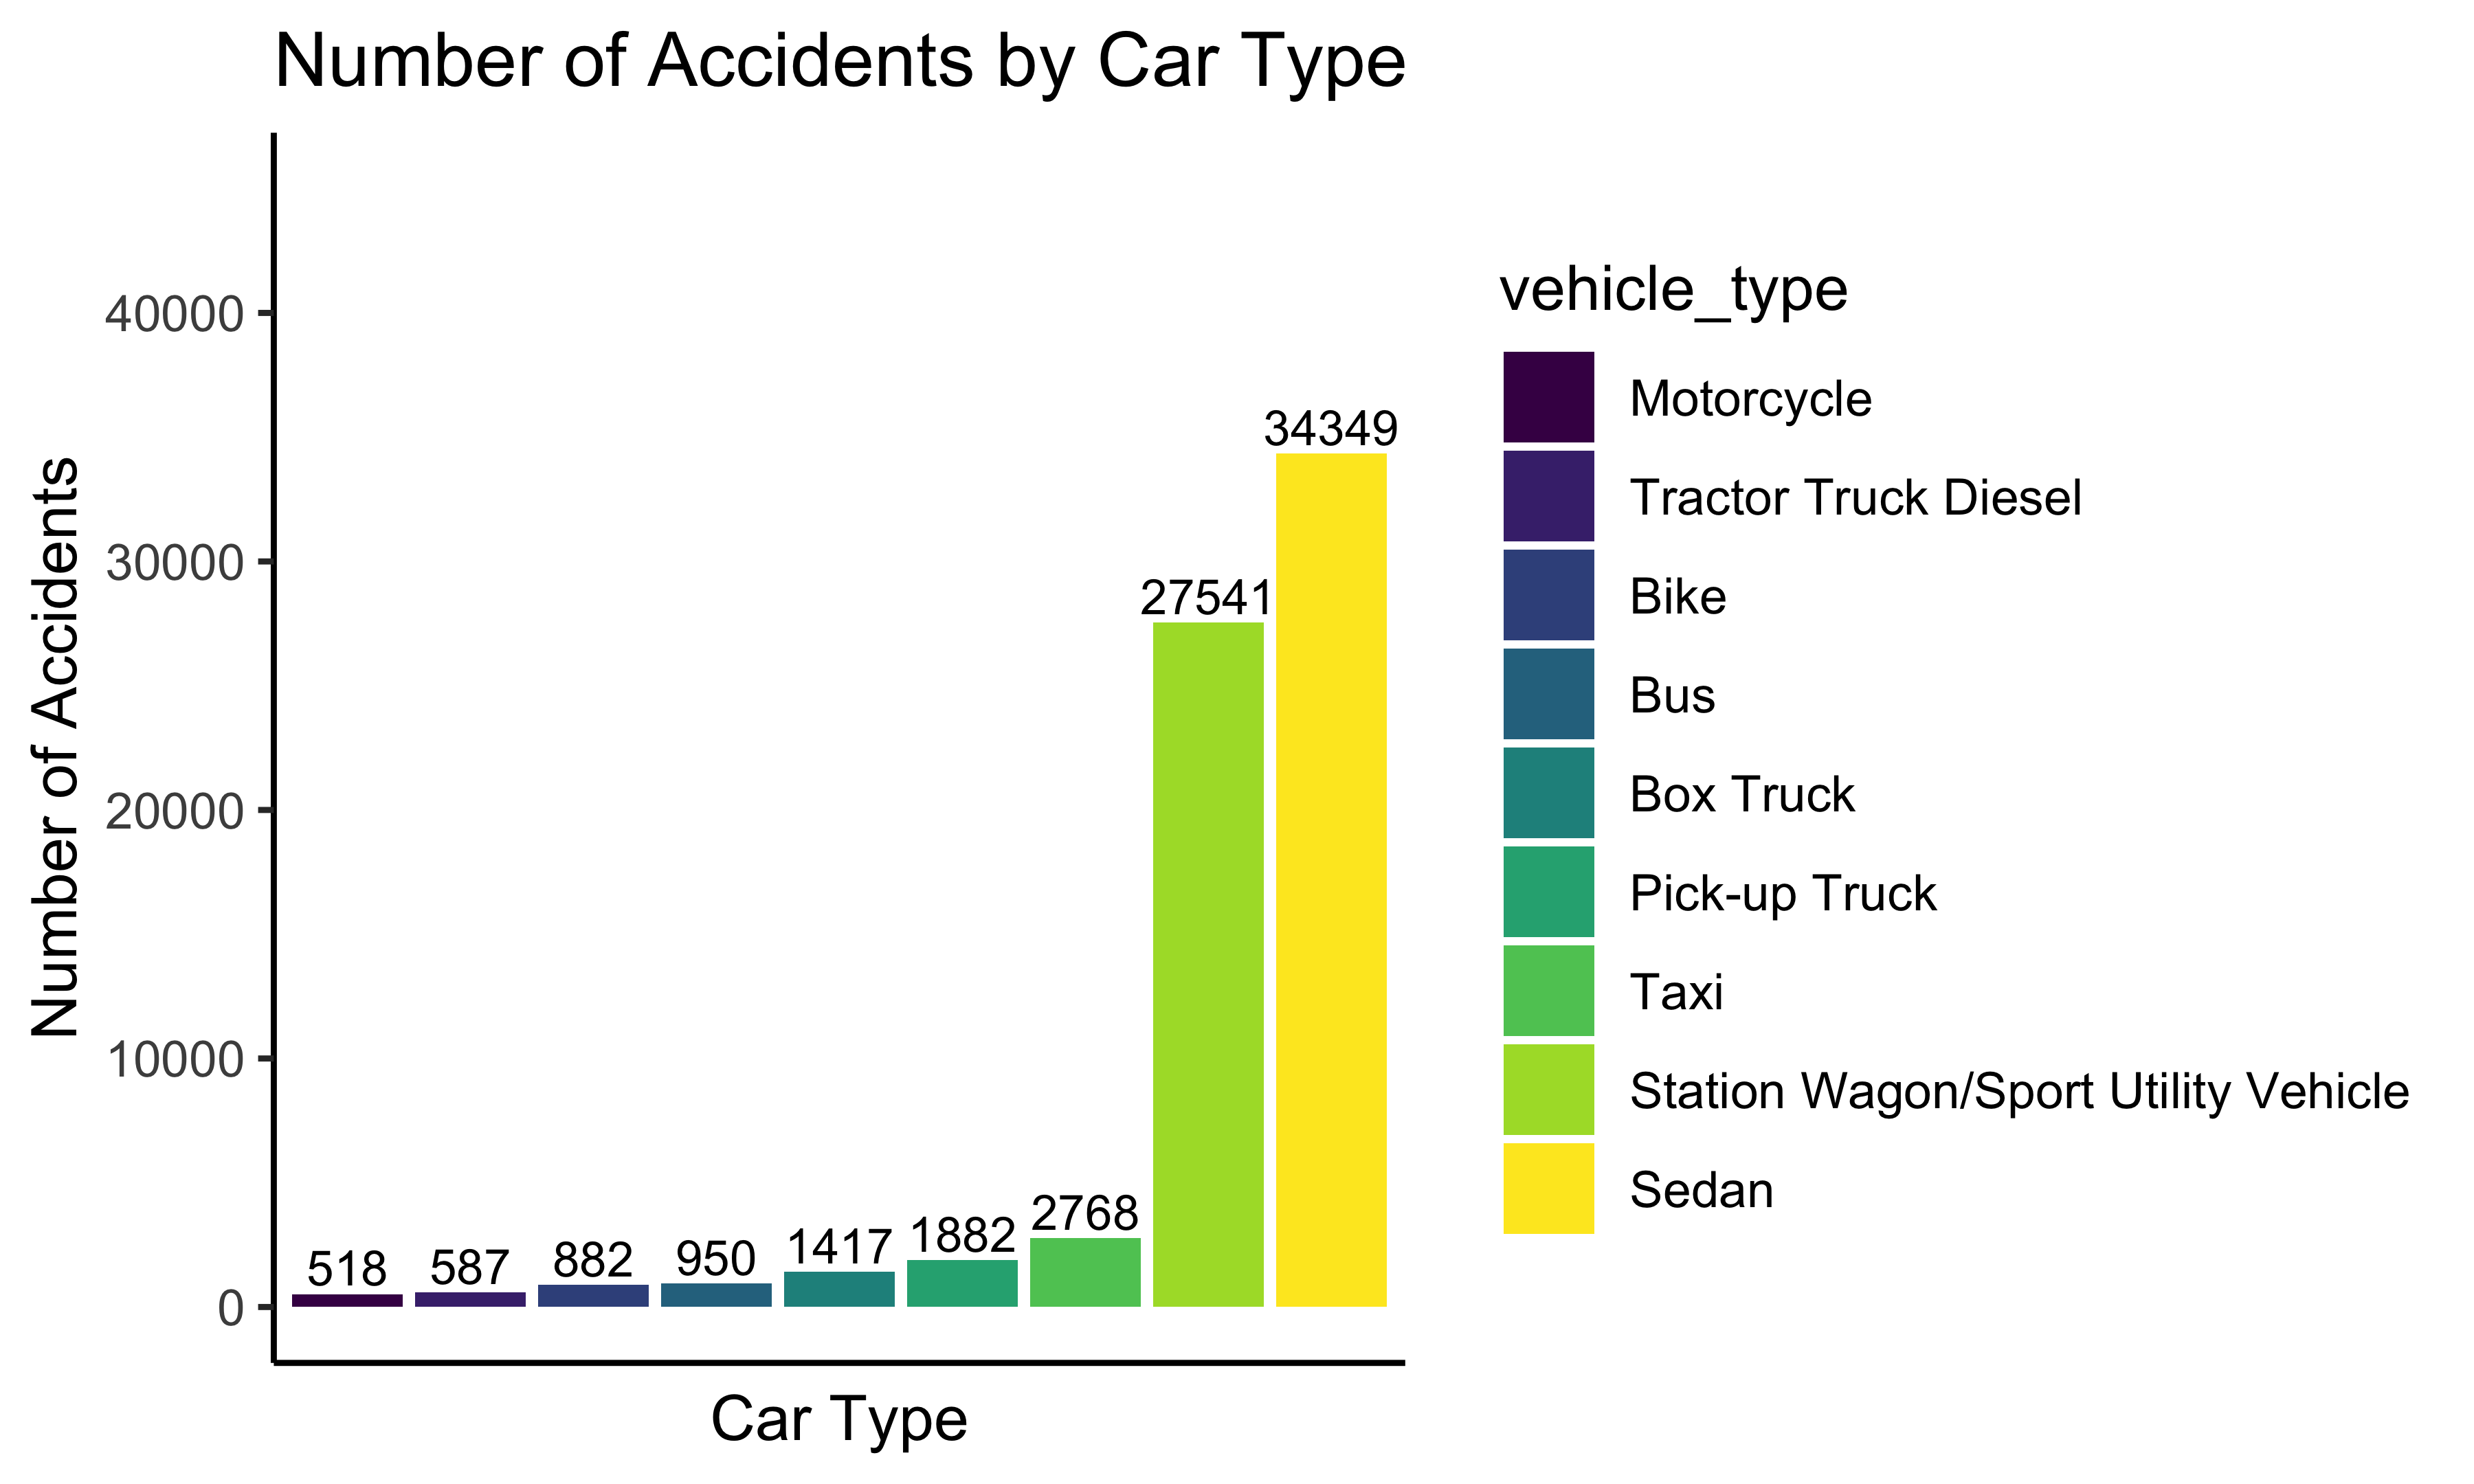
The plot shows the frequency (>500) of accidents by car type. There are mainly two types of cars with much higher frequencies than other types: sedan and station wagon/sport utility vehicle. The frequencies of these two types in 2020 are more than 25000. Other common types are taxi, pick-up truck, and box truck. The frequencies of these three types are more than 1000. Other types are bus, bike, tractor truck diesel, and motorcycles also have a frequency higher than 500.